
Objective: How to Identify Charting Reversal Patterns ( Double Top & Bottom , Head and Shoulders) and how to trade them as well
[Click here For Double Top and Double Bottom PDF]
How to Trade Double Tops and Double Bottoms
Double Top
A double top is a reversal pattern that is formed after there is an extended move up. The “tops” are peaks which are formed when the price hits a certain level that can’t be broken.
After hitting this level, the price will bounce off it slightly, but then return back to test the level again. If the price bounces off of that level again, then you have a DOUBLE top!
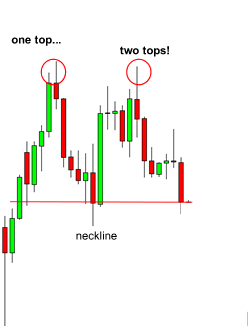
In the chart above you can see that two peaks or “tops” were formed after a strong move up.
Notice how the second top was not able to break the high of the first top. This is a strong sign that a reversal is going to occur because it is telling us that the buying pressure is just about finished.
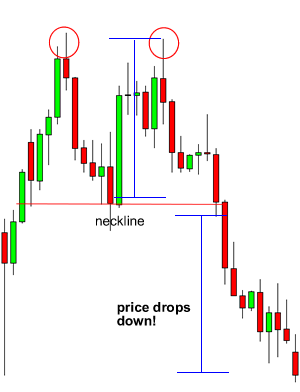
With the double top, we would place our entry order below the neckline because we are anticipating a reversal of the uptrend.
Wow! We must be psychic or something because we always seem to be right!
Looking at the chart you can see that the price breaks the neckline and makes a nice move down. Remember that double tops are a trend reversal formation so you’ll want to look for these after there is a strong uptrend.
You’ll also notice that the drop is approximately the same height as the double top formation. Keep that in mind because that’ll be useful in setting profit targets.
Double Bottom
The double bottom is also a trend reversal formation, but this time we are looking to go long instead of short. These formations occur after extended downtrends when two valleys or “bottoms” have been formed.

You can see from the chart above that after the previous downtrend, the price formed two valleys because it wasn’t able to go below a certain level.
Notice how the second bottom wasn’t able to significantly break the first bottom. This is a sign that the selling pressure is about finished, and that a reversal is about to occur.

Will you look at that!
The price broke the neckline and made a nice move up.
See how the price jumped by almost the same height as that of the double bottom formation?
Remember, just like double tops, double bottoms are also trend reversal formations. You’ll want to look for these after a strong downtrend.
[Click here For Head and Shoulders PDF]
How to Trade the Head and Shoulders Pattern
Head and Shoulders
A head and shoulders pattern is also a trend reversal formation.
It is formed by a peak (shoulder), followed by a higher peak (head), and then another lower peak (shoulder). A “neckline” is drawn by connecting the lowest points of the two troughs. The slope of this line can either be up or down. Typically, when the slope is down, it produces a more reliable signal.
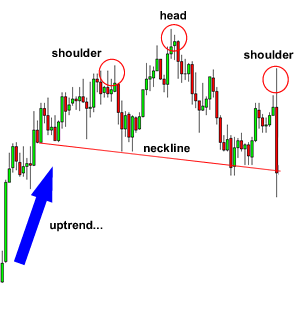
The head is the second peak and is the highest point in the pattern. The two shoulders also form peaks but do not exceed the height of the head.
With this formation, we put an entry order below the neckline.
We can also calculate a target by measuring the high point of the head to the neckline. This distance is approximately how far the price will move after it breaks the neckline.

You can see that once the price goes below the neckline it makes a move that is at least the size of the distance between the head and the neckline.
We know you’re thinking to yourself, “the price kept moving even after it reached the target.”
And our response is, “DON”T BE GREEDY!”
Inverse Head and Shoulders
The name speaks for itself. It is basically a head and shoulders formation, except this time it’s upside down.
A valley is formed (shoulder), followed by an even lower valley (head), and then another higher valley (shoulder). These formations occur after extended downward movements.

Here you can see that this is just like a head and shoulders pattern, but it’s flipped upside down. With this formation, we would place a long entry order above the neckline.
Our target is calculated just like the head and shoulders pattern. Measure the distance between the head and the neckline, and that is approximately the distance that the price will move after it breaks the neckline.

You can see that the price moved up nicely after it broke the neckline.
If your target is hit, then be happy with your profits. However, there are trade management techniques where you can lock in some of your profits and still keep your trade open in case the price continues to move your way.
You will learn about those later on in the course.