Please be aware you must be an active member to access the recordings and live classroom. The recordings are available to you directly through the platform, we have simply organized it to make your experience more enjoyable.
Ensure you are logged into IM.Center Prior to Clicking a Training (Click Here to Log In)
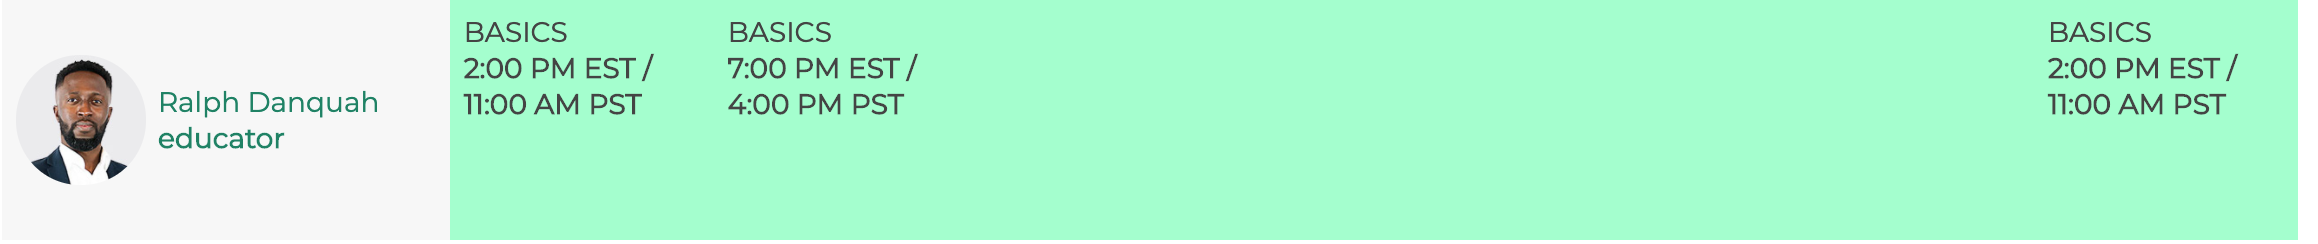
Click Educators Below to Attend Live Basics Training And Complete The Training Below


INTRODUCTION TO FOREX
While participating in the Foreign Exchange can be very lucrative, it is also vitally important to understand what the Foreign Exchange actually is, knowing why people trade in the Foreign Exchange, the best times to trade, how to review currency pairs, as well as understanding the different types of analysis there is. Get your pen and notepad ready because in this introduction, we will be covering just that.
What is Forex (Click Here)
History Of Forex (Click Here)
Forex is short for the Foreign Exchange. The Forex market is the most liquid market in the world. It exchanges approximately $6.6 Trillion per day opposed to less liquid markets such as the New York Stock Exchange that exchanges approximately $20 Billion per day. People turn
to trade the Forex markets for a variety of reasons, some which I have listed below: You can trade from anywhere in the world
Most liquid market in the world Traders can profit whether a specific currency is increasing or
decreasing in valueForex does not require a high initial investment. Traders can begin with as little as $100 which makes Forex all the more popular High liquidity allows large amounts of leverage. Some brokers allow leverage up to 1:1000 The goal of Forex is to buy a currency that is anticipated to gain value or sell a currency that is anticipated to lose value against another currency.
What do people trade? (Click Here)
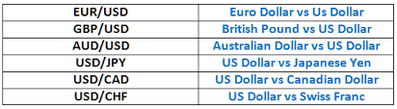
When trading Forex, it is inevitable that traders will run across currencies known as “The Majors”. This term refers to the most
frequently traded currencies in the world, with a list normally including the Euro (EUR), US Dollar (USD), Japanese Yen (JPY), Great British
Pound (GBP), Australian Dollar (AUD), and the Swiss Franc (CHF). In the graph below, you will find a list of the Major currencies along with
their associated country and ISO Symbol. The symbol is how you will know exactly which currency you are trading when referencing a Forex
Bid/Ask quote. However, it is also important to review each currencies nickname. These names will often come up in research and will be
handy when communicating with other Forex Traders.
CURRENCIES
Currencies are always abbreviated by three letter symbols. The first two letters identify the country, and the third letter represents the type of currency in that country.
Take the Canadian dollar for example (CAD) - the CA stands for Canada, and the D stands for dollar.
When To Trade in the Markets (Click Here)
24 hour market
The currency market operates 24 hours a day, 5 days a week. It doesn't open and close each day like the stock market, which means price can fluctuate smoothly all week. Stocks on the other hand are subject to "gapping" when the market opens each morning (for example, if bad news came out after the closing bell on the previous day). This can cause big problems if the market gaps in the opposite direction to your trade.
Market Hours (All times are Eastern Standard Time):
New York session opens at 8:00 am to 5:00 pm EST (Monday - Friday)
Tokyo session opens at 7:00 pm to 4:00 am EST (Monday - Friday)
Sydney session opens at 5:00 pm to 2:00 am EST (Monday - Friday)
London session opens at 3:00 am to 12:00pm EST (Monday - Friday)
* The market is closed most of the weekend. Sunday is when the forex market opens with the Sydney session at 5:00 p.m. So basically, the market is open 5 full days a week (120 hours).
* Hot hours for trading are 02:00 am - 11:00 a.m. EST because of the overlap of NY and London session which creates more opportunities for market movement and trades.
Best Days of the Week to Trade Forex
So now we know that the London session is the busiest out of all the other sessions, but there are also certain days in the week where all the markets tend to show more movement. Know the best days of the week to trade forex.
Below is a chart of average pip range for the major pairs for each day of the week:
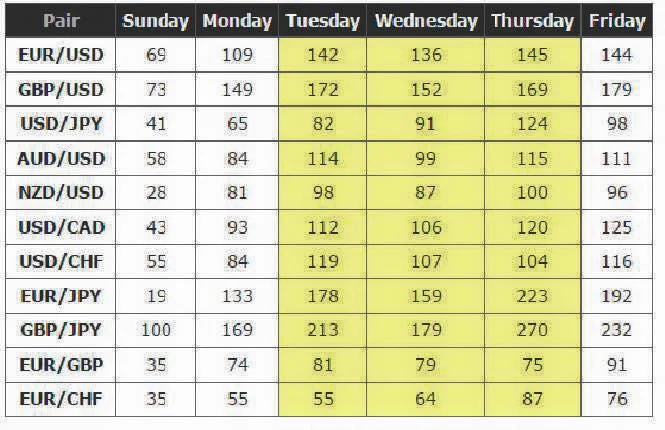
As you can see from the chart above, it would probably be best to trade during the middle of the week, since this is when the most action happens.
Fridays are usually busy until 12:00 pm EST and then the market pretty much drops dead until it closes at 5:00 pm EST. This means we only work half-days on Fridays.
The weekend always starts early!
So based on all these, we’ve learned when the busiest and best days of the week to trade forex are. The busiest times are usually the best times to trade since high volatility tends to present more opportunities.
Best Times of Day to Trade Forex
When two sessions are overlapping of course! These are also the times where major news events come out to potentially spark some volatility and directional movements. Make sure you bookmark the Market Hours cheat sheet to take note of the Opening and Closing times.
The European session tends to be the busiest out of the three.
The middle of the week typically shows the most movement, as the pip range widens for most of the major currency pairs.
Tokyo – London Overlap
Liquidity during this session is pretty thin for a few reasons. Typically, there isn’t as much movement during the Asian session so, once the afternoon hits, it’s pretty much a snooze fest. With European traders just starting to get into their offices, trading can be boring as liquidity dries up.
This would be an ideal time to take a chill pill, play some putt-putt or look for potential trades to take for the London and New York sessions.
London – New York Overlap
This is when the real shebang begins! You can literally hear traders crack their knuckles during this time, because they know they have their work cut out for them. This is the busiest time of day, as traders from the two largest financial centers (London and New York) begin duking it out.
It is during this period where we can see some big moves, especially when news reports from the U.S. and Canada are released. The markets can also be hit by “late” news coming out of Europe.
If any trends were established during the European session, we could see the trend continue, as U.S. traders decide to jump in and establish their positions after reading up what happened earlier in the day. You should watch out though, at the end of this session, as some European traders may be closing their positions, which could lead to some choppy moves right before lunch time in the U.S.
Worst Times to Trade:
Sundays – The market is just waking up! There might be some good setups but be CAUTIOUS
Fridays – liquidity dies down during the latter part of the U.S. session.
Holidays – everybody is taking a break.
Major news events – you don’t want to get whipsawed!
What is a PIP? (Click Here)
The unit for measuring the price of a currency is called a "pip", which stands for "Percentage In Point". Professional traders often refer to pips as “points”. When reading a price quote, the pip is the 4th decimal place. If AUD/USD rises from 1.0520 to 1.0525, that is a 5 pip rise in price. Similarly if it rises from 1.0520 to 1.0540, that is a 20 pip rise in price.
The exception to this rule is any currency pair that includes the Japanese Yen. A yen pair only ever goes to 2 decimal places. If GBP/JPY rises from 125.20 to 125.40, that is a 20 pip rise in price.
You must have a good understanding of pips and how to measure them, as this is the foundation of risk management which is an integral part of any solid trading strategy.
BUY VS SELL (Click Here)
Going Long/Short
Long means you are buying the base currency selling the quoted currency and going short means you are selling the base currency and buying the quoted currency.
How to Review a Currency Pair
The reason currency is quoted in pairs is because you are simultaneously buying one currency and selling the other.
Example:
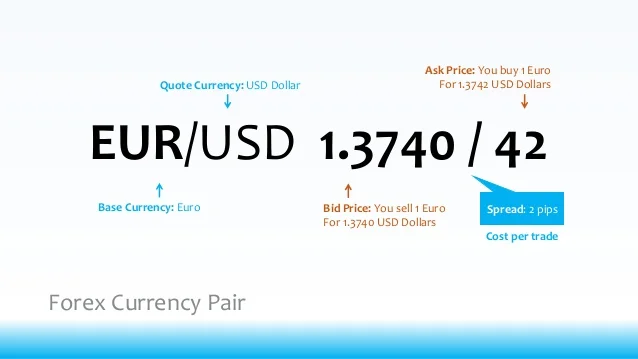
Bid/Ask Prices (Click Here)
Majority of the time the bid is lower than the asking price.
The bid price is the best available price the broker is willing to buy the base currency for in exchange for the quoted currency to sell to market.
The ask price is the best price at which your broker will sell the base currency for in exchange for the quoted currency. This means the ask price is the best available price to purchase from the market.
The “Spread” (Click Here)
A “spread” is simply the difference between the bid and ask price
RISK MANAGEMENT
What are Lot Sizes (Click Here)
1.00 = $10 per pip
0.50 = $5 per pip
0.10 = $1 per pip
0.05 = $0.50 per pip
0.01 = $.10 per pip
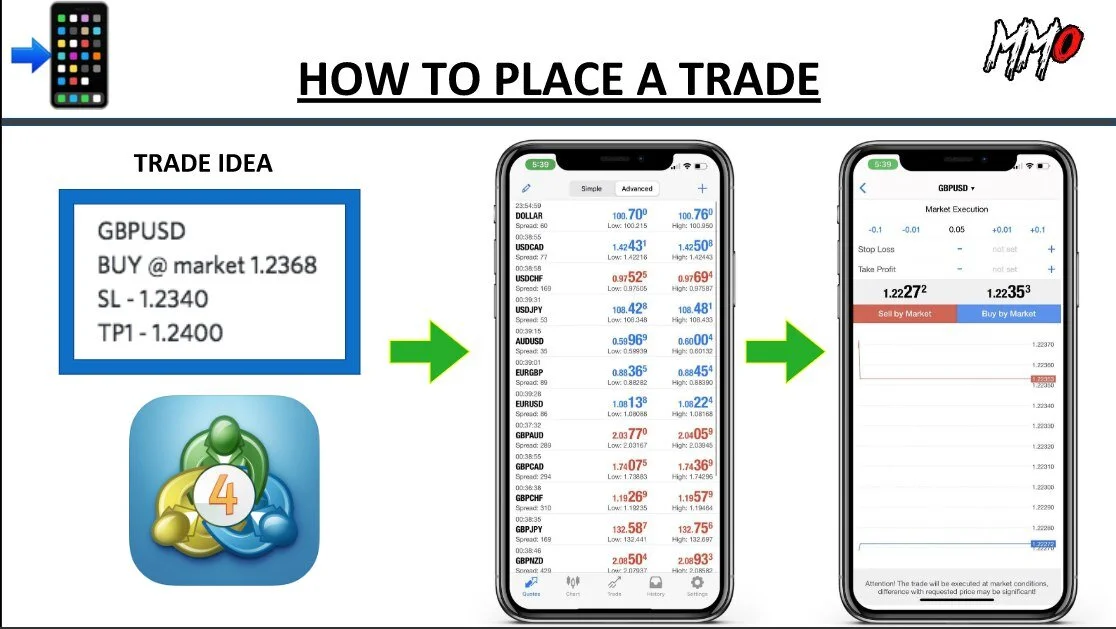
How To Place Trades on your phone
Iphone (Click Here)
Android (Click Here)
Your Trading Window (Click Here)
What is a Stop Loss (Click Here)
Three Types of Forex Market Analysis? (Click Here)
Technical Analysis
Fundamental
Sentimental
UNDERSTANDING CANDLESTICKS AND THEIR REVERSAL PATTERNS
What is Price Action? (Click Here)
Price action is the movement of a security's price plotted over time. Price action forms the basis for all technical analysis of a stock, commodity or other asset chart. Many short-term traders rely exclusively on price action and the formations and trends extrapolated from it to make trading decisions. Technical analysis as a practice is a derivative of price action since it uses past prices in calculations that can then be used to inform trading decisions.
What is a Trend (Click Here)
A trend is a tendency for prices to move in a particular direction over a period. Trends can be long term, short term, upward, downward and even sideways. Success with forex market investments is tied to the investor's ability to identify trends and position themselves for profitable entry and exit points
What is Support and Resistance (Click Here)
Support and Resistance is one of the most commonly used ideas in trading, the idea is that Support is a level at which price will not fall below, and one which price would bounce of and move upwards instead, think of it as the floor. Resistance is the level at which price will not rise above and a level at which price is likely to bounce downwards from, think of it as the ceiling. In the example below you can see price bouncing between Support and Resistance levels during an up trend.
What is a PullBack (Click Here)
A pullback is very similar to retracement or consolidation, and the terms are sometimes used interchangeably. The term pullback is usually applied to pricing drops that are relatively short in duration - for example, a few consecutive sessions - before the uptrend resumes.
How to Draw Fibonacci (Click Here)
Forex traders use Fibonacci retracements to pinpoint where to place orders for market entry, taking profits and stop-loss orders.
Confirmation Checklist (Click Here)
Implementing a trading checklist is a vital part of the trading process because it helps traders to stay disciplined, stick to the trading plan, and builds confidence. Maintaining a trading checklist presents traders with a list of questions that traders need to answer before executing trades.
Technical Analysis Confluent Trading (Click Here and Log In)
Extra Things to Remember When Trading:
1. Never trade more than 5-10% of your account balance at any given time!
2. If you lose 3 trades in a row, quit for the day. It might just be an unpredictable market day.
3. Don't be an emotional trader! Loses do happen, but stay consistent with the trading rules and money management.